dig is a command line tips for querying DNS name servers for information about host addresses, mail exchanges, name servers, and related information. Understanding the
Read more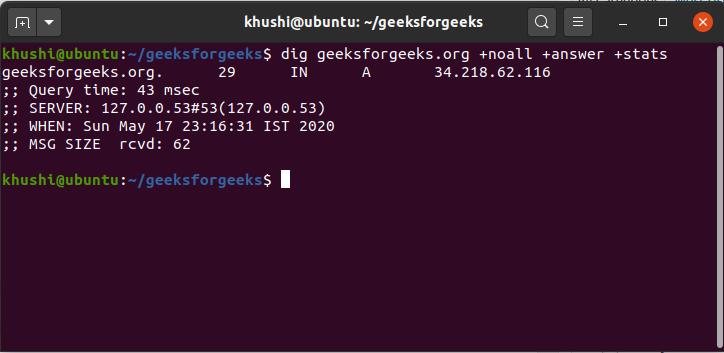
dig is a command line tips for querying DNS name servers for information about host addresses, mail exchanges, name servers, and related information. Understanding the
Read more
System Admin Tools:First of all lets learn how to find out what is chocking or gobbling up the server resource. You can get the memory
Read more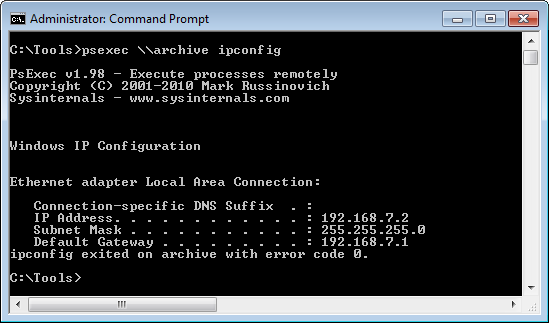
Now I am going introduce you to a set of commands & System Admin Tools that may come handy FIND [bash]find -perm 777 -type d
Read more